General terms
Long exposure Photography is closely related to Neutral Density filters which are semi-transparent pieces of glass that get placed in front of your lens. What makes them special, however, is that they obstruct a precisely controlled fraction of incoming light, and do so uniformly. The obstruction also aims to be equal across the visible spectrum, thereby not introducing a color cast (although this isn’t always the case). This last characteristic also happens to be why it’s called a neutral density filter. Even though they might appear gray or even opaque to our eyes, this isn’t how your photo will appear; the camera’s metering automatically compensates by letting in more light. However, the viewfinder will still appear very dark, so photographers often compose their image prior to placing the filter in front of the lens.
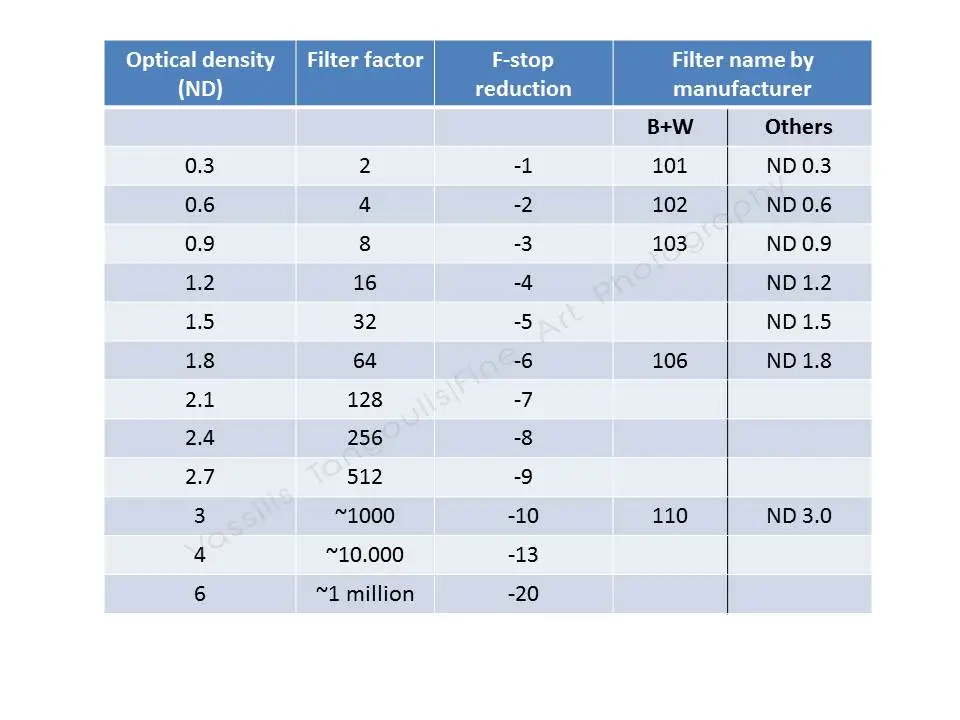
Unfortunately for consumers, manufacturers do not use a standardized classification system to describe the strength of their filters. For example, B+W designate its 1000x grey filter after the f-stop reduction: 110, while others like Formatt Hitech, Lee designate their filters using a density factor. So, a B+W filter of 110 would correspond to a Formatt Hitech filter of ND 3.0. Hoya designates its 9 f-stop grey filter by x400 based on its filter factor which is somehow lower than the absolute value of x512.
Lets see an overview of the different descriptions concerning ND filters as a function of f-stop reduction and optical density but adding also a new parameter the filter factor.
What is the filter factor?
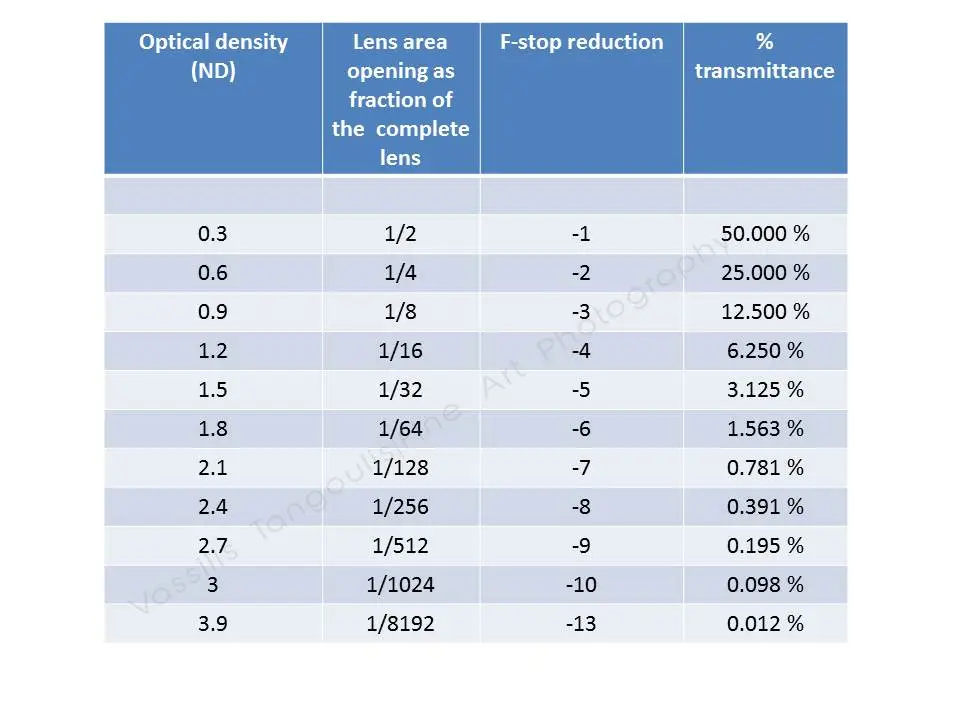
Each “stop” of light-reduction corresponds with a halving of light. A given filter strength therefore passes only 1/2 strength of the initial incoming light, where “strength” is the filter strength in stops. For example, a 3-stop ND filter (ND 0.3) therefore only passes 1/8th the incoming light (since 1/2^3= 1/(2*2*2) = 1/8). So for this filter the filter factor is 8, and the transmittance (allowing light to pass in %) is the inverse number in % , that is 12.5%. In the below table, you can clarify the properties of each filter.
What happens if we stack ND filters?
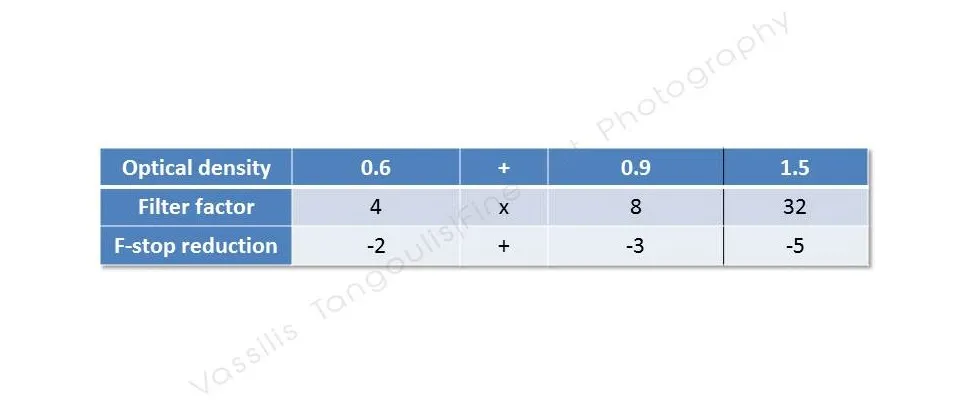
It is very common to stack ND filters to increase their light-reducing strength, but adding multiple filters to the end of a lens can cause vignetting. Keep in mind that no matter how many ND filters are used, the densities of the filters were added and the filter factors need to be multiplied. For example, if you start with an ND filter with a density of 0.6 and add another filter of 0.9 density, the total density of those two filters would be 1.5. This filter combination achieves an f-stop reduction of -5, while the total filter factor of this combination is 32 as illustrated in the table below.
Basic steps to perform a Long exposure shot
- First you have to find out the unfiltered exposure time. Measure this with your camera in aperture priority mode using your desired f-stop.
- Switch to Bulb mode
- If you used AUTOFOCUS in aperture priority mode DO NOT forget to switch to MANUAL when you go to Bulb mode
- In Bulb mode: set the same aperture you selected in step one, and choose the appropriate exposure time (always have with you a stopwatch to time the exposure)
- Those of you who are fully confident working in manual mode will be able to measure the unfiltered exposure time in manual mode and then adjust the exposure length as required.
- In a very bright day when probably the sun is behind you, you may need to think about covering the viewfinder before engaging the shutter. There are several ways of doing this:
- Cover the camera with a dark cloth.
- Use some thick masking tape (electrician’s tape) over the viewfinder.
- Use a small cap which is designed for this purpose.
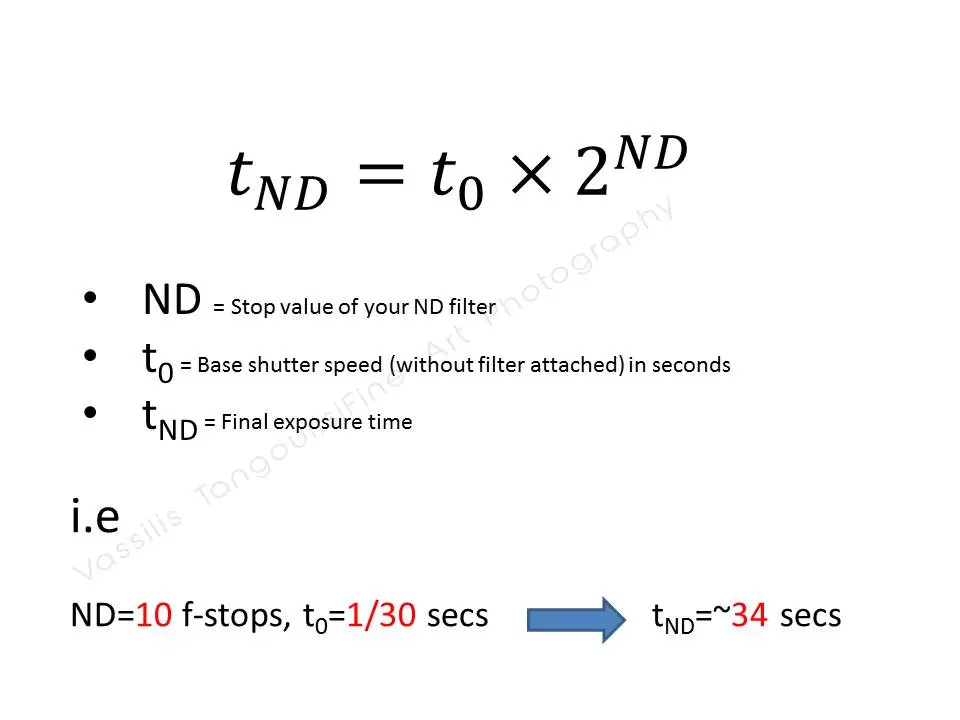
Is there a mathematical formula to calculate the exposure times?
Yes, there is a simple mathematical formula and it is described in the following figure with a simple example.
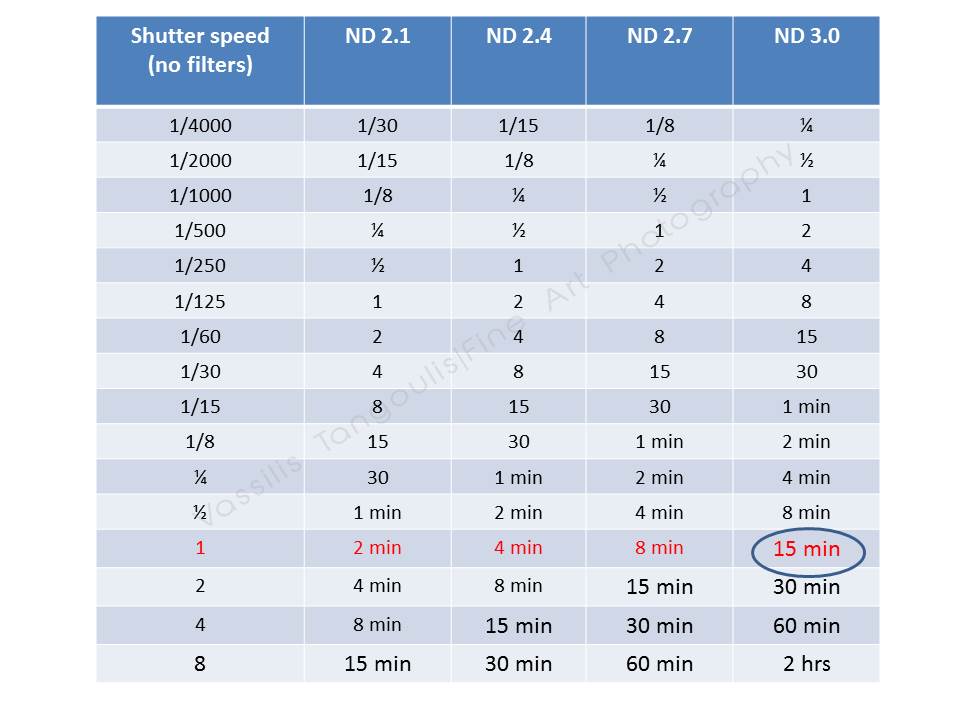
Useful timetables
I have compiled some useful tables where you can find the appropriate exposure time when you have already chosen the unfiltered time and the type of ND filter you use. All the values are in seconds except it is declared otherwise.
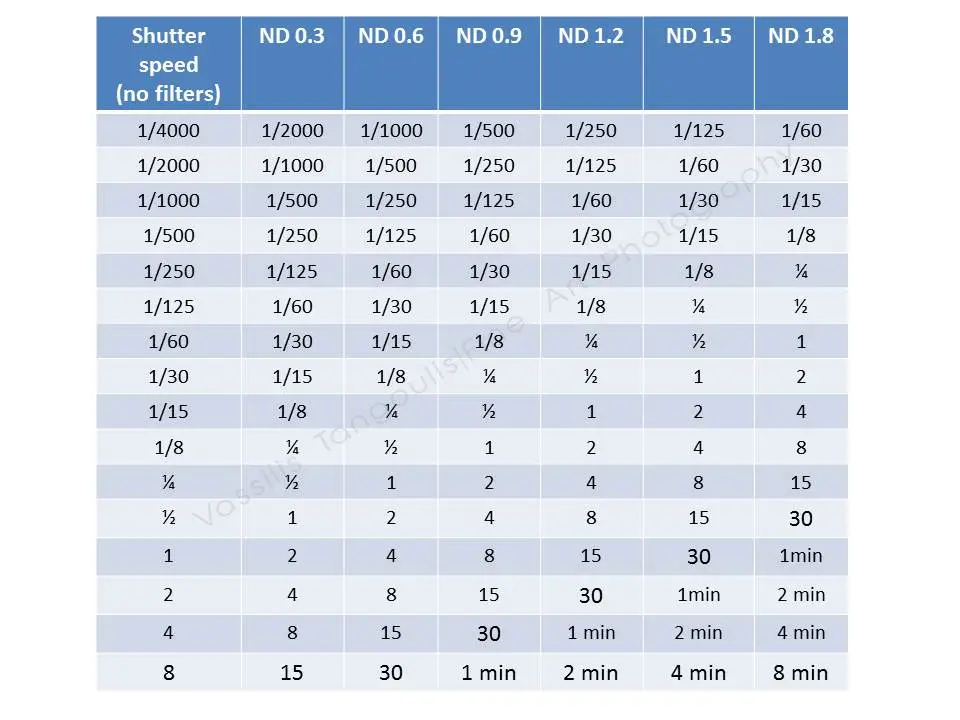
I believe this table below is maybe more useful since it deals with darker ND filters and longer exposure times. How can we read these tables? Check first the unfiltered shutter speed you want (this is the one you determine form the aperture priority settings..) and then go all the way following the row to the intersection with the appropriate column where you see your ND filter. And that is your new exposure time. Lets say for example you read in your camera settings a shutter speed of 1 sec (very low-light scene) then (see table below) if you are using a ND 3.0 filter , that is a 10 f-stop reduction, you need to time 15 minutes with your stopwatch when you take your photo in Bulb mode.
Is that all? I am afraid no.. and i will give the reasons in the next section.
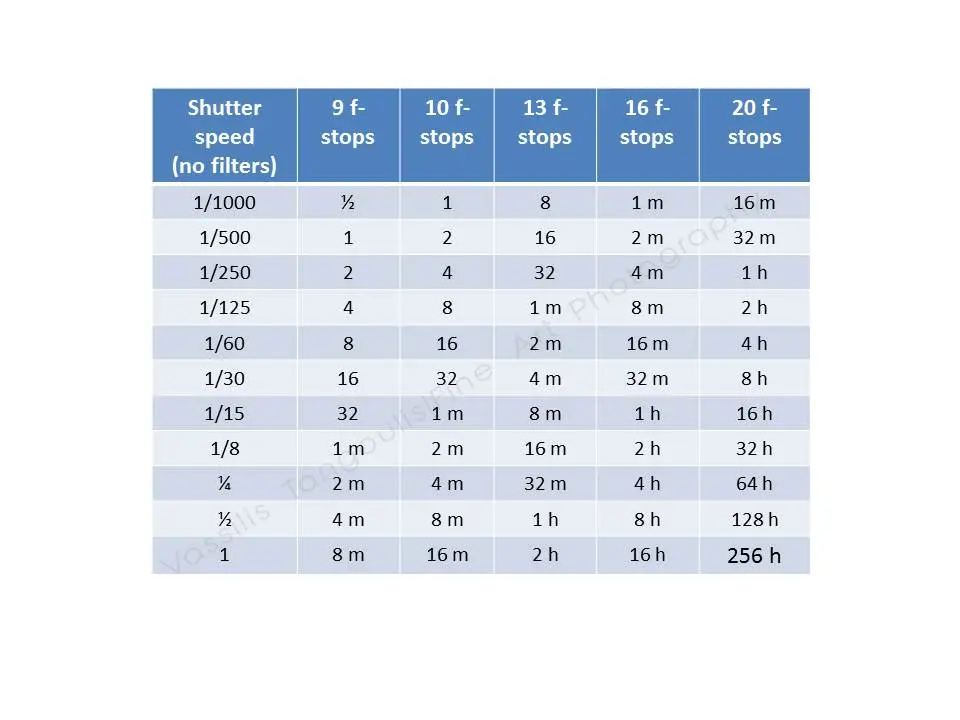
Just to finish with the tables i will give you a most useful table where we can have exposure times for stacking filters. Be aware and use the minimum number of filters to achieve your required number of f-stop reduction. What i mean? If you want to achieve a 16 f-stops reduction use a 10- and a 6- filter and not combinations like -6, -6, -4. Increasing the number of ND filters can cause serious vignetting problems. You can work both ways with this chart (and every chart in this post).
- You want to make an exposure of approximately 1 hour (maybe a traffic scene where you do not want to have the cars movement or people moving around..). You check first the setting of your photo without filters and lets say you have a value of your Shutter speed close to 1/15 secs. Then looking at this table below you see that for an hour exposure you need 16 f-stops. You put two -8 or -10 and -6 and that’s it!
- You have two -10 stops filters (that is two ND 3.0’s) and you want to calculate the exposure time when the settings without filter give you a shutter speed of 1/250. Then after looking at this table you go for an hour of exposure time
How accurate are these tables?
In theory these tables should give you accurate exposure times. However that’s not always true with very dark filters and very long exposures. For the ND filters up to 5- or 6-stops these charts works perfectly but the darker the ND filter, the less reliable these tables get. For example, (check the last table) if a camera calculates an exposure of 1/60 i would need for 3- and 10-stops stacked ND filters an exposure of 2 minutes. This is true in theory, but doesn’t always quite work out right in real life. If you expose at 2 minutes, the image will be very underexposed. So what is recommended is to go 2 or even 3 stops further, using 4 or 8 minutes of exposure time. There are two possible reason for this:
- First of all manufacturers aren’t that precise when describing the filter factor of their ND filters, especially when the filter factor gets big. A manufacturer could say that their 9-stop filter has a filter factor of five hundred twelve or five hundred or simply four hundred (see Hoya NDx400).
- The second possible option could be due to some kind of digital equivalent to ‘reciprocity failure’, which is a phenomenon experienced when shooting extra long exposures with film. The reason for such reciprocity failure with film is that the longer the exposure, the less effective the film is in recording the light and so the exposure length needs to be increased.
Still i found from my experience that these tables are quite accurate even for ND 3.0 filters when there is a lot of light in the scene.
Any other way to calculate times?
You can always use the simple but trusted method of trial and error. You take an underexposed image using exposure time of 60 seconds? Take another one at 90 secs. This is overexposed somehow? then stay to values close to 70 secs. You should take into consideration the fact that if you shoot at, say, 400 seconds, adjusting the next shot to 415 seconds is not going to make any significant change. You should try with changes of 70-80 or even 100 secs to see differences.
Any applications for mobiles ?
There are always some convenient applications for android, i-phones that help to solve all these problems in calculations and i will add here some links. Concerning the i-phone users there are some applications ( i am sure you can find even more) like:
- Long Exposure Calculators By Ilya Genkin Photography (non-free)
- NDCalc By Boris Nienke (non-free)
- LongTime Exposure Calculator By Thomas Penn (This is a free application)
For the users of android smartphones there is a free application with the name Exposure Calculator.
Concluding remarks
Every scene is unique concerning the light conditions and the dynamic changes of light. There is no rule, no application, no table, no mathematical formula to describe the best way to calculate the exposure time in a long exposure shot. Use your instinct, imagination and experience and you will soon know even before you take a shot what will be the ideal exposure time for your photograph.
Still there are some special light conditions (close and afters sunset) where you have to choose the right settings for your camera since you will have maybe only one or two shots to take before the absolute dark. All these special conditions among others will be discussed in detail during my workshops. I also think it is good to print these charts out and laminate them to keep in your camera bag for reference.
Hope you enjoyed it and wait for your comments!